Reports
Reports
Filtering Reports
Click here to access reports page in LeadCenter.
Advantages of filters in Looker Studio
Filters in LeadCenter are important for several reasons:
- Data exploration: Filters allow users to quickly drill down into specific subsets of data. This is crucial for exploring data and gaining insights. Users can narrow down their focus to particular time ranges, geographic regions, product categories, or any other relevant dimensions.
- Customization: Filters provide flexibility in data visualization, allowing users to tailor data to their specific needs or questions. This enhances the relevance and usefulness of the visualizations.
- Interactivity: Filters enable interactivity in dashboards and reports. Users can dynamically change the data displayed by adjusting filter settings, allowing for real-time exploration and analysis. This interactivity promotes engagement and empowers users to extract insights more effectively.
- Data analysis: Filters facilitate in-depth data analysis by enabling users to isolate specific segments of data for comparison or analysis. Whether it’s comparing performance across different regions or analyzing trends over time, filters make it easier to focus on the relevant data points.
Dimensions and metrics in LeadCenter reports
Dimensions
A set of unaggregated data values that can be used to group data. Examples of dimensions include campaign name, advisor name, event type, etc.
Metrics
An aggregation of values that measure dimensions. Examples of metrics include total leads, total appointments, total production, etc.
Filters are applied to dimensions to see metrics related to this dimension. For example, you can filter the production report by the dimension advisor to see the production metric for this advisor.
Filtering data in LeadCenter
Reports in LeadCenter can be filtered across one or multiple dimensions. Also, there are three ways to apply filters:
- Top filters: By using the filters section at the top of the report.
- Chart filters: By clicking on a metic inside a chart.
- Table filters: By clicking on a row or cell inside a table.
1. Top filters
Each report will contain filters at the top of the page that look like this:

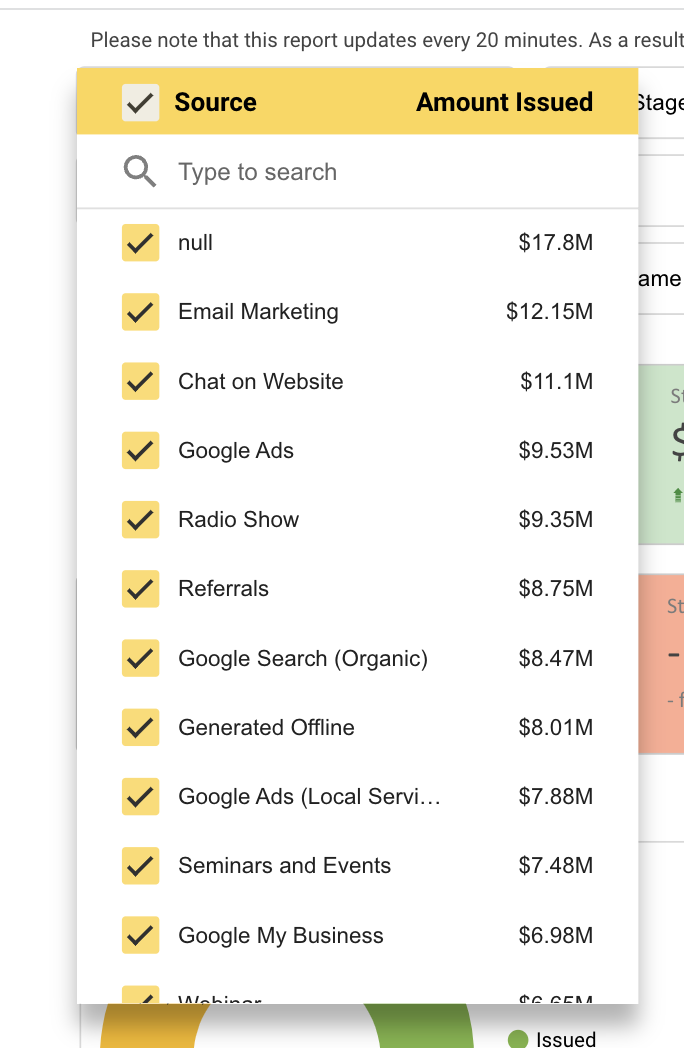
Each dimension has a dropdown to filter the report from the range of dimension values. For example, in a production report, you can filter the entire report by one or multiple sources by clicking on the source dropdown.
Date filter
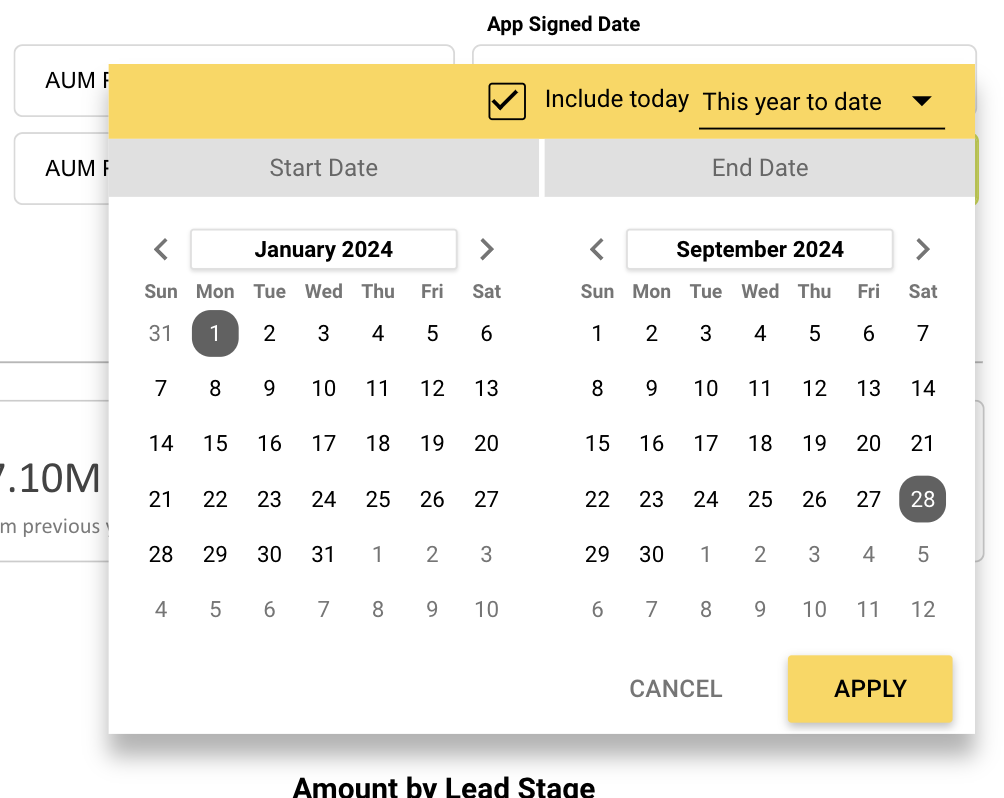
by default, reports are filtered on the year-to-date range. You can update the date filter to include a custom date range.
You can also use one of the built-in date ranges like the last 7 days, last 30 days, etc.
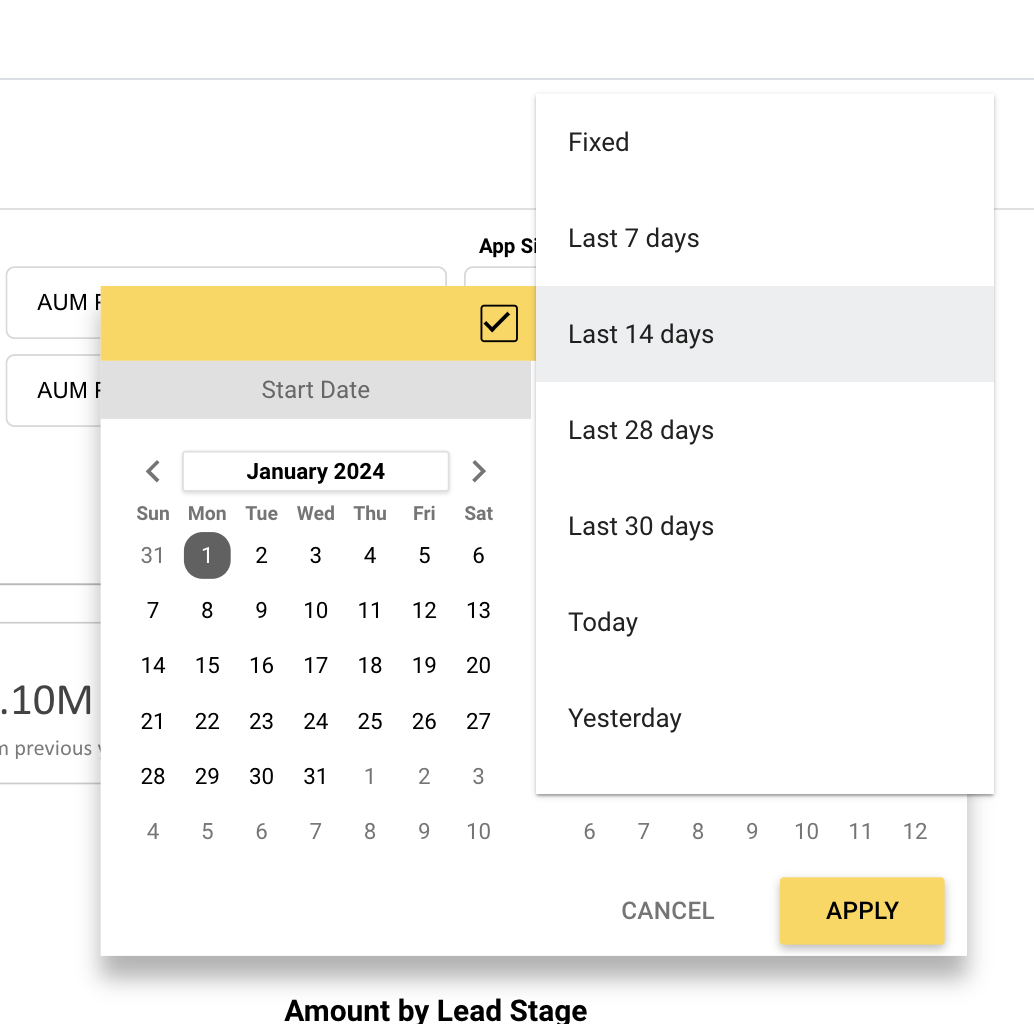
Chart filters
You can filter reports by clicking on a dimension or metric within a chart.
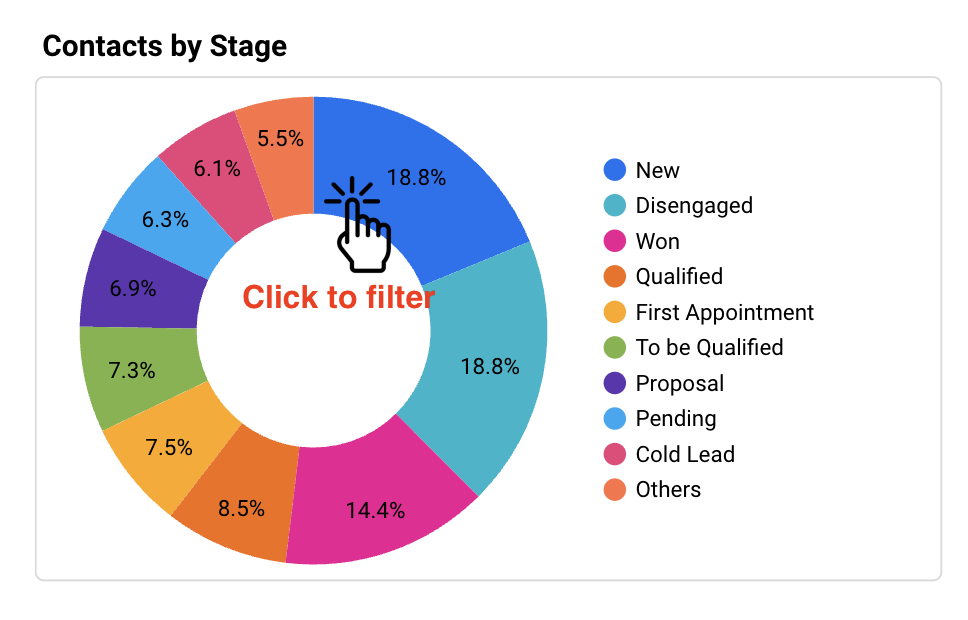
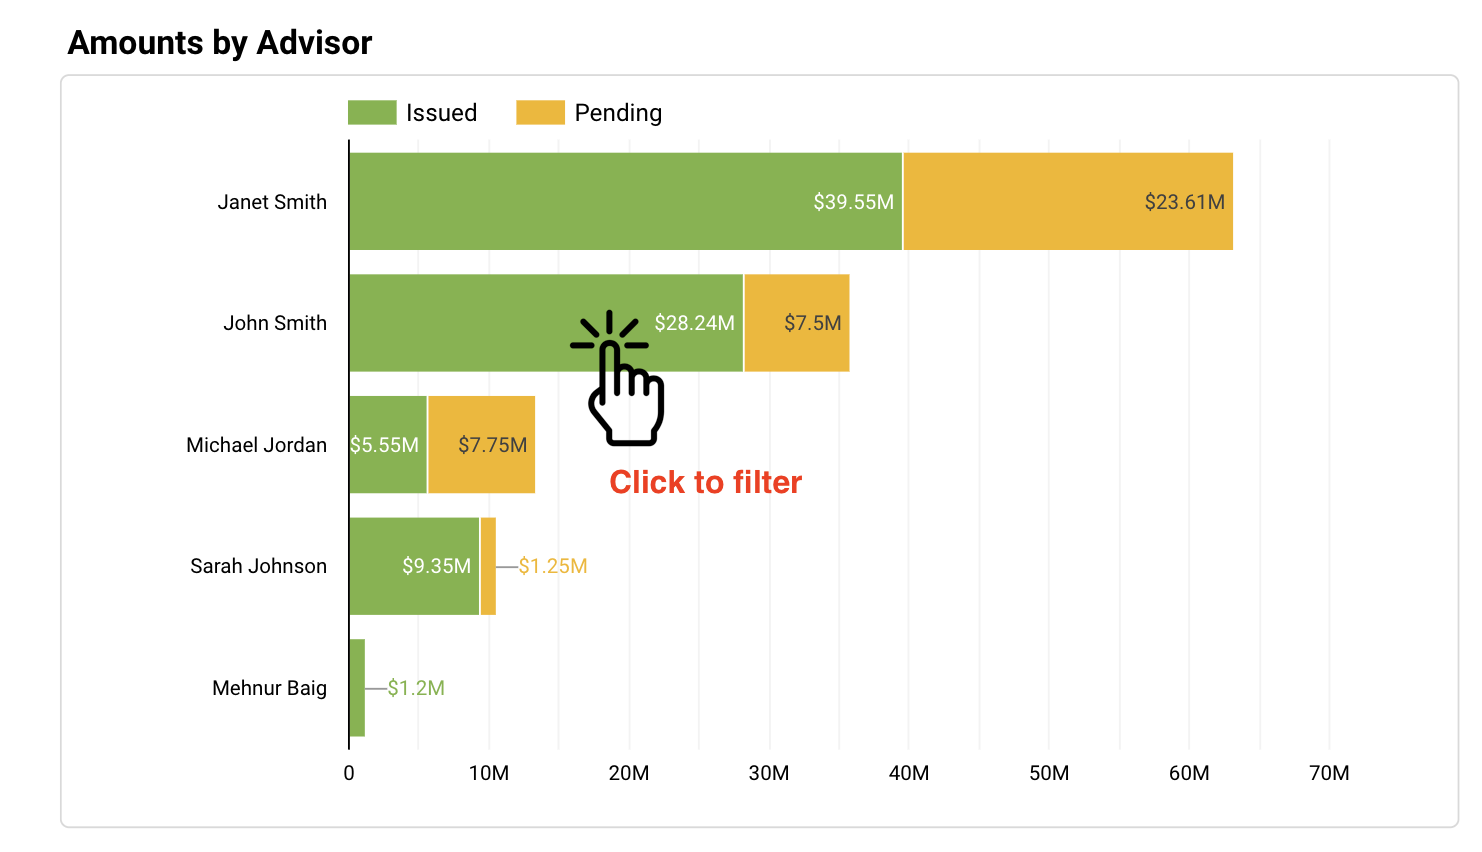
When you click on a chart dimension or metric, the entire report will be filtered by this dimension or metric.
Table filters
You can filter reports by clicking on any cell or row within a table.

Resetting filters
To reset the report filter to the default, click on the reset filter button at the upper right corner of the report under the date filter. You can also unselect the filter you have chosen using one of the methods above.

Need more help?
If you can’t find the answers you’re looking for, our support specialists are available to answer your questions and troubleshoot if necessary.
-
Phone Call (888) 291-7116. Our main hours are Monday to Friday 7 am-5 pm Central Time.
-
Support Ticket Send your questions and inquiries via email to support@leadcenter.ai. A support ticket will be created and one of our team members will get back to you as quickly as possible.
