 Help Center
What's New
Manage Your Sales Pipeline with the New Kanban View
11/03/2025
We’ve introduced a brand-new Kanban View for your Sales Pipeline — designed to give you a more visual, interactive way to manage your leads and opportunities. You can now view all your pipeline stages in a drag-and-drop board format and instantly see where every lead stands.
What’s New
The new Kanban View mirrors your existing Sales Pipeline stages and filters — just in a more visual layout. You can move contacts between stages by simply dragging and dropping them, making pipeline management faster and more intuitive.
How to Access the Kanban View
- Go to the Sales Pipeline page.
- Click the new Kanban View (grid icon) located at the top right beside the Actions dropdown.
- Your pipeline will switch to the new board-style view — each column representing a stage from your existing table view.
- Drag and drop contacts between stages to update their progress instantly.
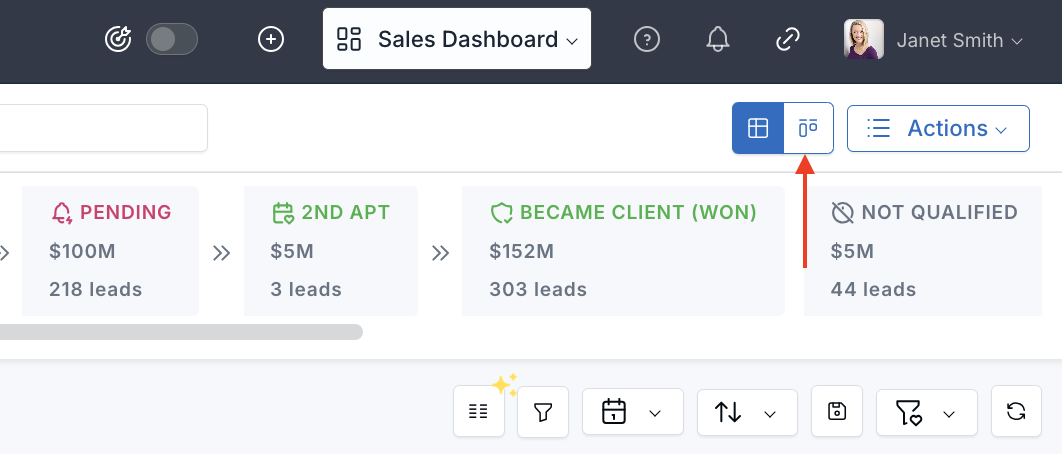
New Kanban View icon beside the “Actions” dropdown.
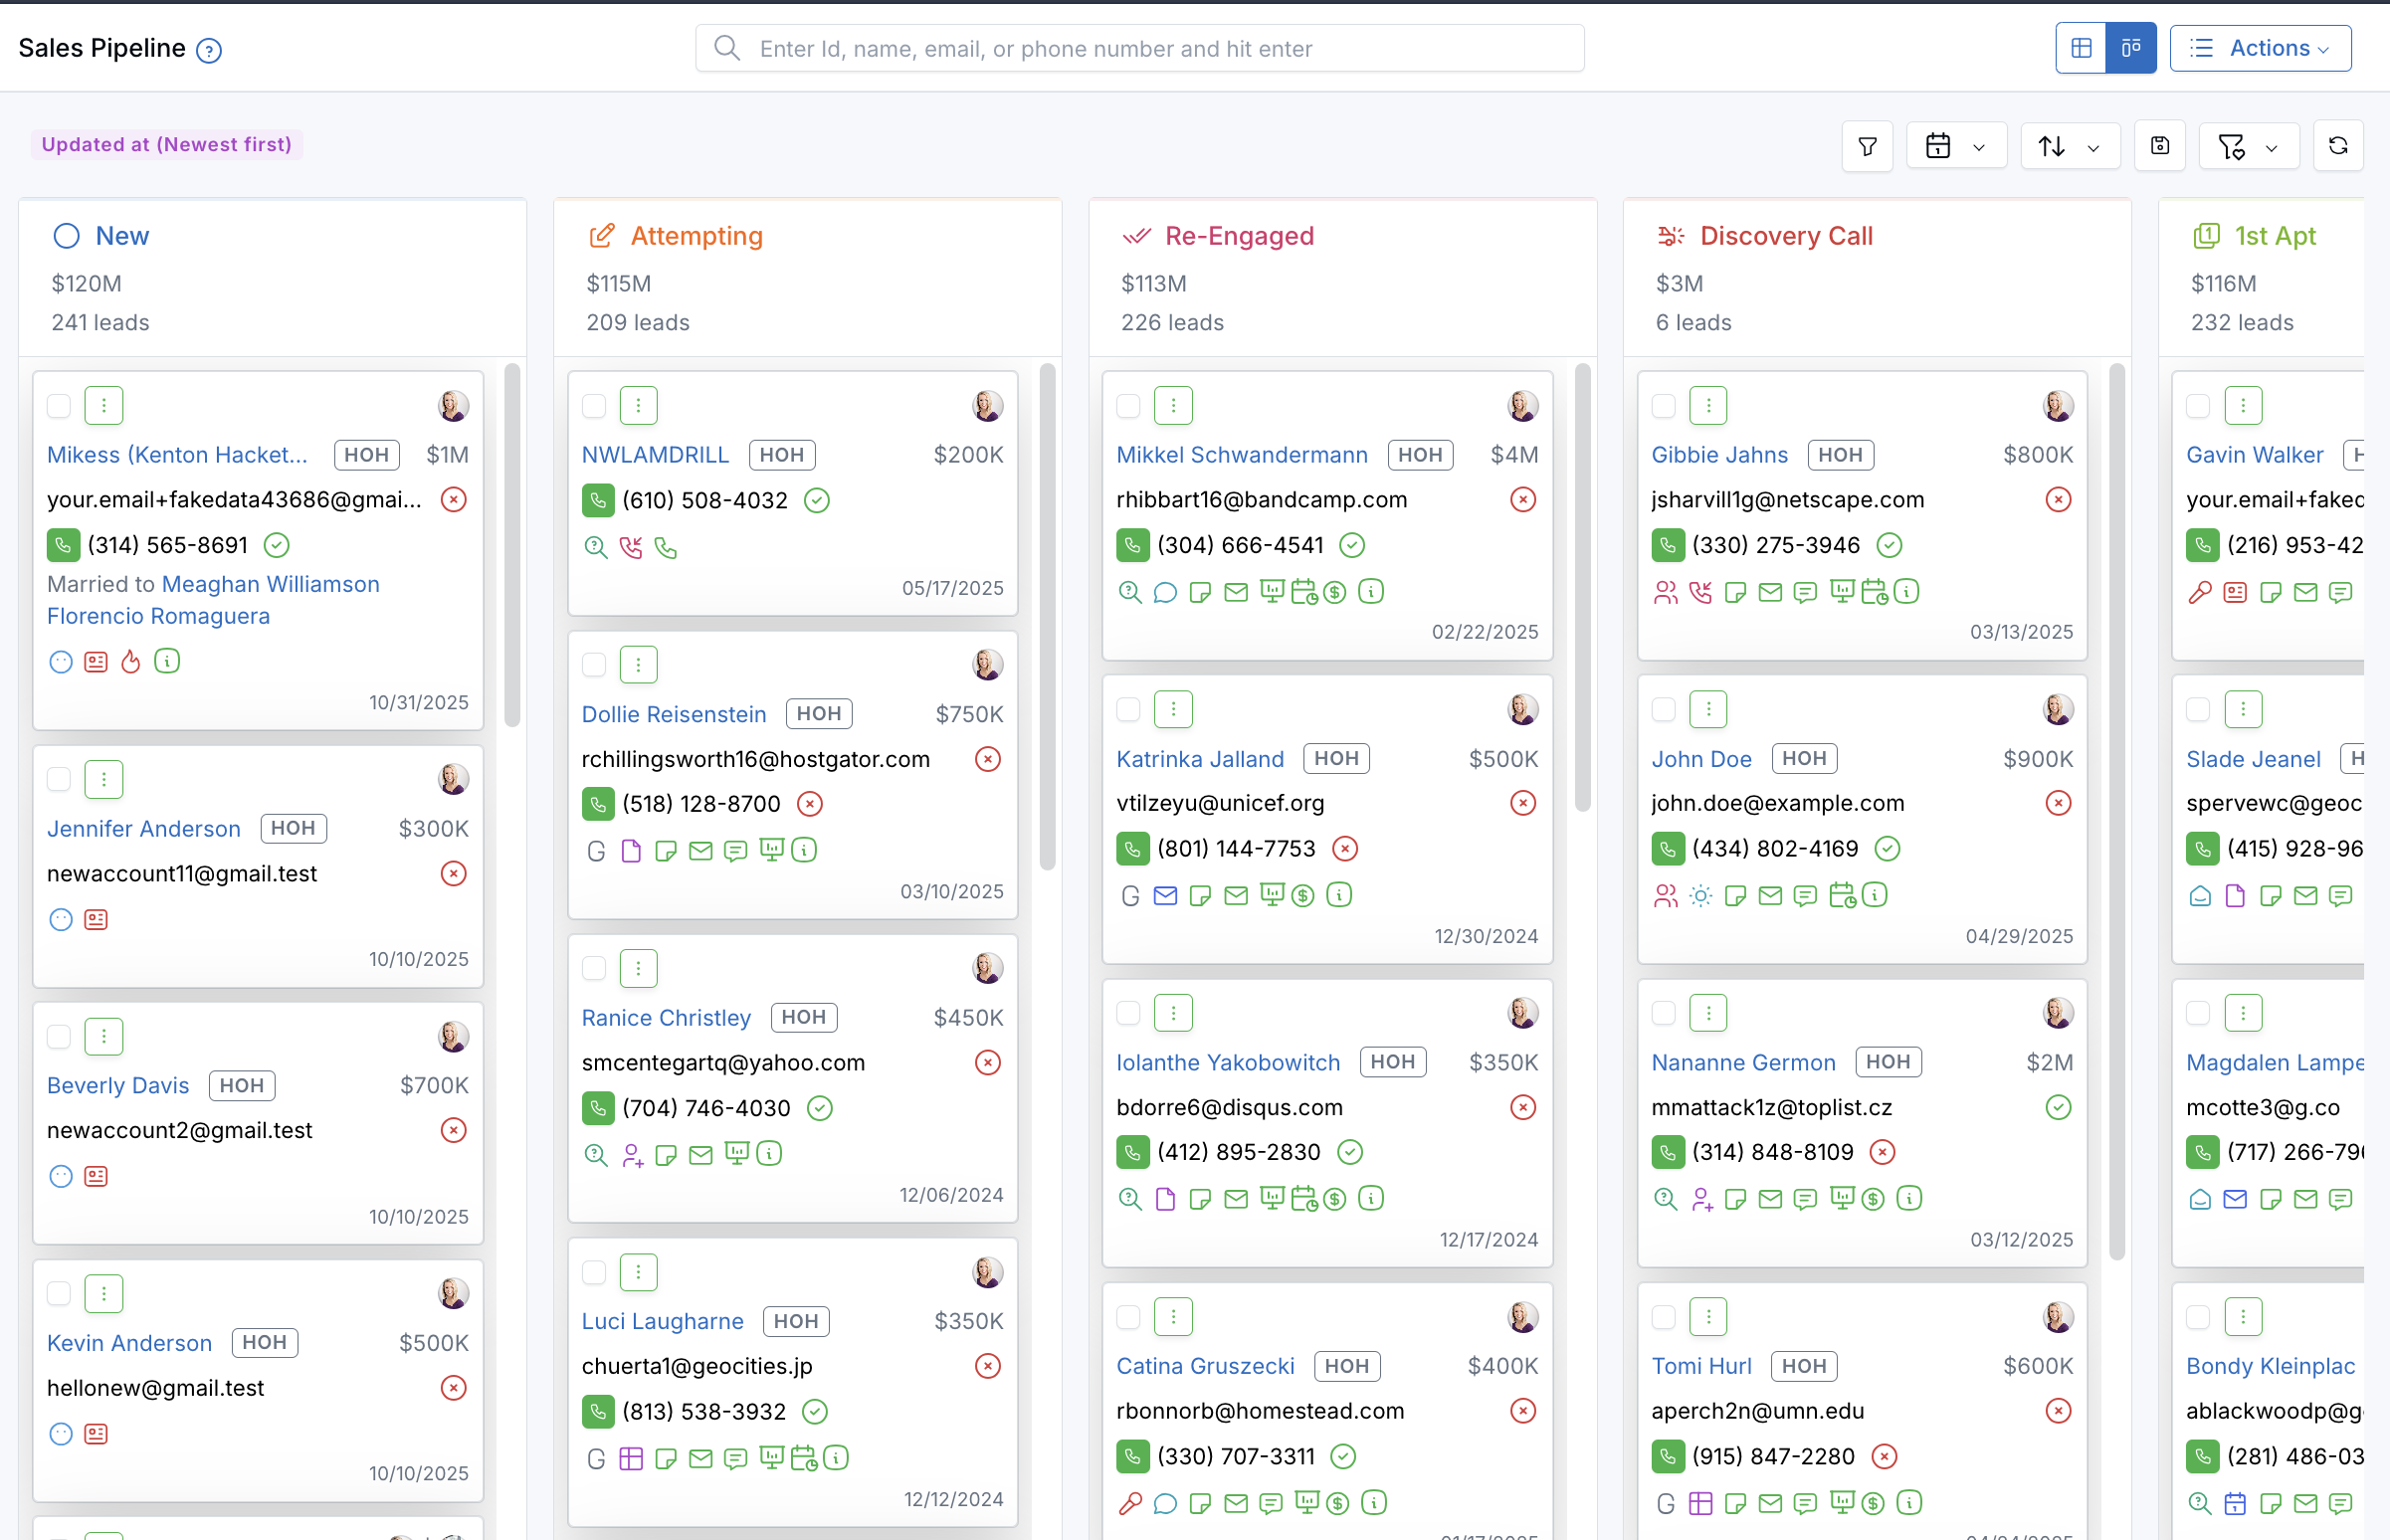
New drag-and-drop Kanban View for the Sales Pipeline.
Expected Production Weighting
In addition to the new view, pipeline stages can now be weighted by Expected Production — giving you a more accurate picture of your pipeline’s total value. Instead of showing only the number of leads per stage, the pipeline now reflects the total expected production for all contacts within each stage.
The Expected Production field is displayed on each contact’s card in the Kanban View and also appears as a column in the Table View. These individual values contribute to the stage totals shown at the top of your pipeline.
You can start updating the Expected Production field for your leads and contacts to see their contribution reflected in your pipeline totals. For details on how to edit this field, see this article.
Note: We’re also updating the Sales Pipeline Report to include these new expected production–based weightings, providing a more complete view of your firm’s sales performance and projected revenue.
Why It Matters
- Visualize your pipeline with an intuitive, drag-and-drop board.
- Quickly update lead stages without switching screens.
- See the true value of your pipeline by tracking Expected Production.
- Gain a clearer picture of your firm’s growth potential and sales performance.
Questions or feedback? Reach out anytime at support@leadcenter.ai.

Need more help?
If you can't find the answers you're looking for, our support specialists are available to answer your questions and troubleshoot if necessary.
-
Phone Call (888) 291-7116. Our main hours are Monday to Friday 7 am-5 pm Central Time.
-
Support Send your questions and inquiries via email to support@leadcenter.ai. A support ticket will be created and one of our team members will get back to you as quickly as possible.